
概述
hdfs 是 hadoop 的一部分, 它有一个命令来下载当前的命名代码快照。我们可以通过 spark 加载图像或对其执行数据接收, 以将其放入 hive 中, 分析数据并验证其如何使用 hdfs。
hdfs 文件系统元数据存储在名为 “fspimage” 的文件中。包含在此快照中, 我们有:
- 整个文件系统命名空间。
- 地图、块和文件复制。
- 属性, 如配额、acls 等。
我必须解决的问题如下:
- 运行该命令下载映像并生成 xml 文件。
- 实现 spark 作业以处理数据并将其保存在 hive 表中。
- 使用 hive sql 分析一些数据, 并使用 gnuplot 绘制数据。
1. 生成 hdfs fs 映像
fsimage 可以生成 csv、xml 或分布式格式的映像, 就我而言, 我必须评估块和acls;因为它们是类型数组的字段, 所以它们在 csv 格式中不起作用。您可以在这里看到更多详细信息:
要生成图像, 请检查它在名称节点中的位置:
hdfs getconf -confKey dfs.namenode.name.dir现在, 让我们下载图像 /tmp 到。在我的示例中, 正在分析的文件的大小为35 gb :
hdfs dfsadmin -fetchImage /tmp现在有必要将其转换为可读格式, 在本例中为 xml:
hdfs oiv -p XML -i /tmp/fsimage_0000000000000103292 -o fsimage.xml1.1 将文件加载到火花中并将其保存到蜂巢表中
我使用 databricks 库进行 xml, 它很容易加载, 因为它已经将数据转换为数据框。你可以在这里看到所有的细节: https://github.com/databricks/spark-xml。
我的 hive 表的结构如下所示:
USE analyze;
CREATE EXTERNAL TABLE IF NOT EXISTS analyze.fsimage_hdfs
(
  id string COMMENT 'Unique identification number.',
  type string COMMENT 'Type of data: directory or file, link, etc...',
  name string COMMENT 'Name of the directory or file..',
  replication string COMMENT 'Replication number.',
  mtime string COMMENT 'The date of modification.',
  atime string COMMENT 'Date of last access.',
  preferredblocksize string COMMENT 'The size of the block used.',
  permission string COMMENT 'Permissions used, user, group (Unix permission).',
  acls string COMMENT 'Access Permissions: Users and Groups.',
  blocks string COMMENT 'Size blocks',
  storagepolicyid string COMMENT 'ID number of the access policies.',
  nsquota string COMMENT 'Quota name, if -1 is disabled.',
  dsquota string COMMENT 'Space available and evaluated for user/group, if -1 is disabled.',
  fileunderconstruction string COMMENT 'File or directory still under construction/replication.',
  path string COMMENT 'Path of the file or directory.'
)
PARTITIONED BY (odate string, cluster string)
ROW FORMAT SERDE 'parquet.hive.serde.ParquetHiveSerDe'
STORED AS INPUTFORMAT 'parquet.hive.DeprecatedParquetInputFormat'
OUTPUTFORMAT 'parquet.hive.DeprecatedParquetOutputFormat'
LOCATION '/powerhorse/bicudo/analyze/fsimage_hdfs';
在这种情况下, 因为还有其他群集要分析, 因此使用 iso 标准接收日和群集名称创建了一个分区。
使用磁盘源 xml库, 可以很容易地使文件中的解析器、读取、修改和保存数据选项 (“rowtag”、”inode”). option (“null value”、”” “). load (pathfimages)
我还创建了一些示例代码, 您可以使用映像运行和测试这些代码: https://github.com/edersoncorbari/scala-lab
1.2 使用 gnuplot 分析信息和绘图
在这些分析中, 我使用 sql 和gn函plot来查看数据。其他一些有趣的工具包括:
继续我们的工作批处理数据, 我们现在可以做一些分析。生成具有群集中最常用的复制值的直方图:
SELECT cast(hist.x AS int) AS x,
       cast(hist.y AS bigint) y
FROM
  (SELECT histogram_numeric(cast(replication AS DOUBLE), 40) AS T0
   FROM analyze.fsimage_hdfs
   WHERE dataingestao='2019-01-27'
     AND CLUSTER='SEMANTIX_NORTH'
     AND preferredblocksize <> '')
   T1 LATERAL VIEW explode(T0) exploded_table AS hist;
有几种类型的图形, 你可以使用 gnuplot, 请在这里寻找更多的例子: gnplot 演示.有必要在直方图中复制输出, 并将其放置在示例文件复制中。
Replication_XReplication_Y
129
13
277975
212602
247204
2139973
217612
224402
3170164
37461229
311038655
31443494
31910188
109267
106492
101719
101207
101318
现在复制下面的代码并运行:
#!/usr/bin/gnuplot
reset
clear

set datafile separator "\t"
set terminal png size 1024,768
set output "histogram-replication.png"

set title "Replication Cluster - Semantix North"
set xlabel "(X)"
set ylabel "(Y)"
set key top left outside horizontal autotitle columnhead

plot 'replication.dat' u 1:2 w impulses lw 10
生成的数据将如下所示:

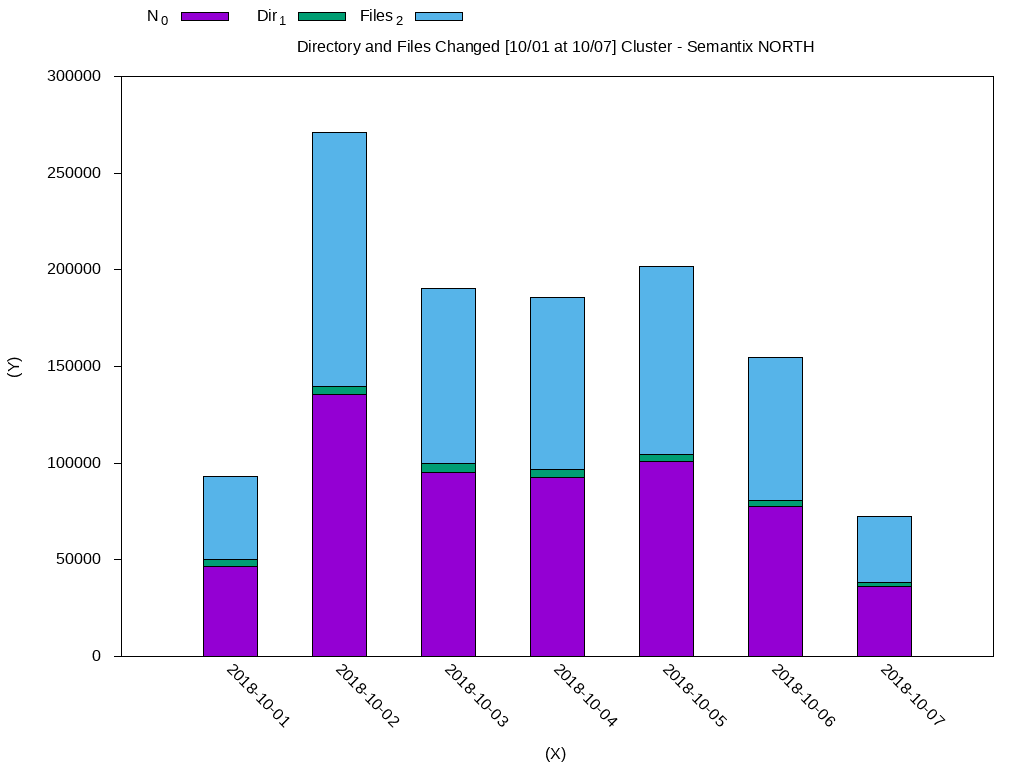
在这种情况下, 大多数数据都在使用复制块3。我们可以做另一个分析, 检查在一周内修改的文件。下面, 我已经标准化了直方图的输出与周变. dat 文件:
DateN_0Dir_1Files_2
2018-10-0146588.03579.043009.0
2018-10-02135548.04230.0131318.0
2018-10-0395226.04600.090626.0
2018-10-0492728.04128.088600.0
2018-10-05100969.03527.097442.0
2018-10-0677346.03455.073891.0
2018-10-0736326.01711.034615.0
使用 gnuclot:
#!/usr/bin/gnuplot
reset
clear

set datafile separator "\t"
set terminal png size 1024,768
set output "histogram-weekly-changes.png"

set title "Directory and Files Changed [10/01 at 10/07] Cluster - Semantix NORTH"
set xlabel "(X)"
set ylabel "(Y)"

set key top left outside horizontal autotitle columnhead
set xtic rotate by -45 scale 0
set ytics out nomirror
set style fill solid border -1
set boxwidth 0.5 relative

set style data histograms
set style histogram rowstacked

plot 'weekly-changes.dat' using 2:xtic(1) ti col, '' u 3 ti col, '' u 4 ti col
生成的数据将如下所示:
我将留下一些其他可能有用的查询:
-- Convert Unix timestamp to ISO选择权限, count(1) as 总文件, 圆 (强制 (强制转换 (优先块大小 as DOUBLE))/1024/1024/1024, 2) as sizegb as 规模从 fsimage _ hdfs 在那里, 在那里, 2019-01-22 ‘ 和 ‘ 集群 ‘ = ‘ 集群 _ north ‘ 集团由 limit 10;
–在特定日期修改的文件。
选择计数 (*) 从 fsimage _ hdfs 在那里的地方是?
1.4 参考资料
帮助撰写本文的文档:
谢谢!